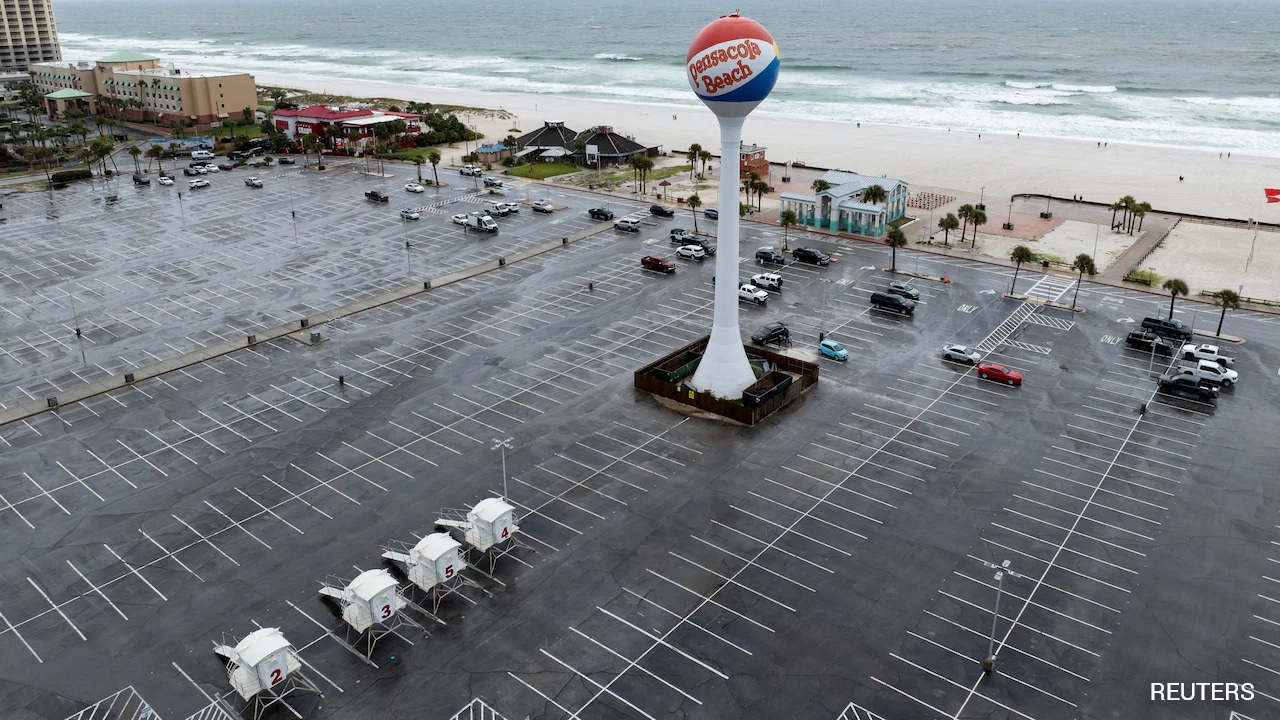
When Hurricane Isaias brushed the eastern seaboard and made landfall, over four hundred thousand customers in Florida lost electrical service within hours. Media reports typically frame such events through the lens of meteorological fury or human hardship. This perspective, while emotionally resonant, obscures the mechanical realities of infrastructure failure. A blackout affecting hundreds of thousands of accounts is not merely an act of weather; it is the predictable outcome of a distributed network operating under specific physical stress limits, asset aging curves, and regional load factors. Deconstructing the mechanics of this grid failure reveals how environmental vectors interact with structural vulnerabilities to produce cascading service interruptions.
The Architecture of Regional Distribution Vulnerabilities
Electrical grids are divided into generation, transmission, and distribution tiers. Major bulk transmission lines rarely fail during moderate tropical events unless subjected to catastrophic wind shears or flooding of substations. Instead, the four hundred thousand outages observed during Isaias predominantly originated in the low-voltage distribution tier—the poles, transformers, crossarms, and overhead lines running through suburban and urban rights-of-way.
Distribution networks function as high-entropy systems. Unlike transmission loops that possess redundant pathways to reroute power when a line drops, local radial circuits often depend on single-path feeds. When a tree limb severs a lateral line serving a residential subdivision, every downstream customer experiences an immediate loss of service.
Environmental Load Versus Material Thresholds
Tropical storm force winds rarely exceed the structural yield strength of modern steel-reinforced concrete transmission poles, but they easily exceed the mechanical thresholds of surrounding vegetation and legacy wooden utility poles.
[Wind Velocity Vector]
       │
       ▼
[Overhead Vegetation Canopy] ──(Dynamic Loading)──> [Conductor Span]
       │                                                    │
       ├────────────────────────────────────────────────────┘
       ▼
[Wooden Pole Flexure Point] ──(Exceeds Modulus of Rupture)──> [Structural Collapse]
The primary driver of mass outages is not wind pressure directly on copper cables, but kinetic impact from the canopy. When sustained winds and gusts cross the critical threshold of thirty-five miles per hour, deciduous and coniferous trees with shallow root systems—exacerbated by soil saturation from prior rainfall—fail structurally. The subsequent interaction between falling timber and energized conductors dictates the scale of the blackout.
The Cost Function of Vegetation Management
Utilities operate under a continuous optimization problem balancing capital expenditure on tree trimming against the economic liability of storm-induced outages. This relationship forms a distinct cost function.
$$C_{total} = C_{trimming}(x) + L_{outage}(x)$$
Where $x$ represents the intensity and clearance radius of vegetation management programs. Under-investing in $x$ minimizes short-term operational expenses but exponentially increases $L_{outage}$—the cumulative cost of emergency repairs, lost revenue, and regulatory penalties following a landfall event.
During events like the Isaias landfall, utilities with aggressive, predictive vegetation management cycles experience localized anomalies rather than systemic collapse. Conversely, networks with deferred maintenance schedules see simultaneous multiple-point failures across feeder circuits. The four hundred thousand disconnected accounts in Florida serve as a direct economic readout of historical clearing thresholds within those specific service territories.
Cascading Failures and the Restoration Bottleneck
Once an outage event exceeds local crew capacity, restoration transitions from a technical problem to a logistical optimization challenge. The timeline of recovery is governed by triage protocols rather than raw manpower.
Damage Assessment ──> Critical Infrastructure Priority (Hospitals, Water) ──> Main Feeder Lines ──> Lateral Distribution Lines ──> Individual Service Drops
- Damage Assessment: Drones, helicopter patrols, and ground crews map the geographical distribution of downed spans and blown transformers. Without accurate telemetry on smart meters—which often fail when local communication nodes lose power—this phase introduces friction.
- Transmission and Substation Repair: Crews must first restore high-capacity nodes. Energizing a lateral line without a functioning substation upstream is futile.
- Feeder Line Reconstruction: Repairing three-phase backbone circuits that feed thousands of homes takes precedence over single-phase residential lines.
- Service Drops: The final phase involves addressing single-customer outages, which explains why a utility can report eighty percent grid restoration while tens of thousands of individuals remain without power for days.
Systemic Resilience Metrics
Evaluating the performance of an electrical grid during a severe weather event requires moving beyond raw headcounts of darkened homes. Metrics such as System Average Interruption Duration Index and Customer Average Interruption Duration Index provide baseline comparisons, but true resilience is measured by recovery velocity and network compartmentalization.
Modernizing distribution architecture requires transitioning from vulnerable overhead radial designs to underground cabling in high-risk corridors, deploying automated reclosers that isolate faulted zones autonomously, and implementing predictive analytics that simulate storm tracks against specific asset inventories in real time. Until capital allocation matches the increasing frequency of climate-driven wind events, mass outages will remain a structural certainty of coastal infrastructure rather than an anomalous emergency.


